Valuing Defensive Actions Using Offensive Possession Models

What’s in a pass? What’s in a dribble? In isolation, there’s not much.
However, when we chain those passes and dribbles together into sequences and possessions, we can learn a lot about buildup play through event-level data. It may be that the pass which came four actions prior to the shot was more consequential than the key pass which led directly to the shot—and new models are beginning to draw out these subtle nuances.
Flip that concept on its head, and we have a serviceable metric for defensive ability. Among other examples, we can determine when pressure scenarios are forcing the ball into less dangerous areas, which players are consistently turning the ball over at inopportune moments, and which players are shutting plays down in the most crucial moments.
If you haven’t already, take a moment to read Karun Singh’s post on what he calls expected threat (XT) and Derrick Yam’s post on StatsBomb’s ball progression model. Both center on offensive production and chance creation, whereas this post will focus primarily on defensive ability and chance elimination. Karun’s model in particular is integral to the analysis that follows, so I’ll do my best to reprise that information in the next section.
Karun’s xT Model
Traditional approaches to measuring value are extensions of expected goal (xG) models—they only recognize the actions which lead directly to optimal shooting opportunities. Motivated by a desire to credit the incisive pass that came from the visionary creative midfielder three moves prior to the goal, analyst Karun Singh “looked beyond checkmate.”
First, the field is divided into a number of zones—192, in this case—and each zone holds an inherent value. That value is determined by historical event data, and it signifies the probability of a goal being scored in the current position, given that the attacking team holds possession in that zone.
When in possession, an attacking player has two choices: move the ball or shoot. So, the value of a zone is the weighted sum of the probability of scoring after passing or dribbling the ball and the probability of scoring directly from a shot.
For example, if an attacking player chooses to shoot from a particular zone 15 percent of the time, and shots from that position result in goals just 10 percent of the time, the weighted value of a shot is 1.5 percent, or 0.015. The remaining 85 percent of the time, an attacking player chooses to move the ball into another zone, and sequences originating from the current position lead to goals just 8 percent of the time—resulting in a weighted value of 6.8 percent, or 0.068. The zone, then, holds a value of 0.083 (0.015 + 0.068).
The original formula is detailed below, where:
\(xT_{x,y}\) is the value of a given zone;
\(s_{x,y}\) is the probability that an attacking player will shoot from a given zone;
\(g_{x,y}\) is the probability that a shot from a given zone will result in a goal;
\(m_{x,y}\) is the probability that an attacking player will pass or dribble from a given zone; and
\(\sum_{z=1}^{16} \sum_{w=1}^{12} T_{(x,y) \rightarrow (z,w)} V_{(z,w)}\) is the probability that a pass or dribble from a given zone will lead to goal within the same sequence (weighted sum over the other 191 zones).
$$xT_{x,y}=(s_{x,y} \times g_{x,y})+(m_{x,y} \times \sum_{z=1}^{16} \sum_{w=1}^{12} T_{(x,y) \rightarrow (z,w)} V_{(z,w)})$$
Attacking players are then scored on each pass and dribble, where the value added or deducted is equal to the value of the zone in which the move ends, subtracted by the value of the zone in which the move began (i.e., \(xT_{z,w}-xT_{x,y}\)).
xT Adaptation
For the purposes of this analysis, I made two adjustments to Karun’s approach. First, I included incomplete moves as a third potential outcome. I set their value at zero, and this deflated the xT values across the board. The formula itself doesn’t change, but \(s_{x,y}+m_{x,y}=1-i_{x,y}\), where \(i_{x,y}\) is the probability that an incomplete move will occur from a given zone (rather than \(s_{x,y}+m_{x,y}=1\) from the original xT formula).
Second, I had a burning desire for all my zones to be perfect squares, so I divided the pitch 18 ways from endline to endline and 12 ways from touchline to touchline, resulting in 216 zones. Each zone is 44.4 square yards.
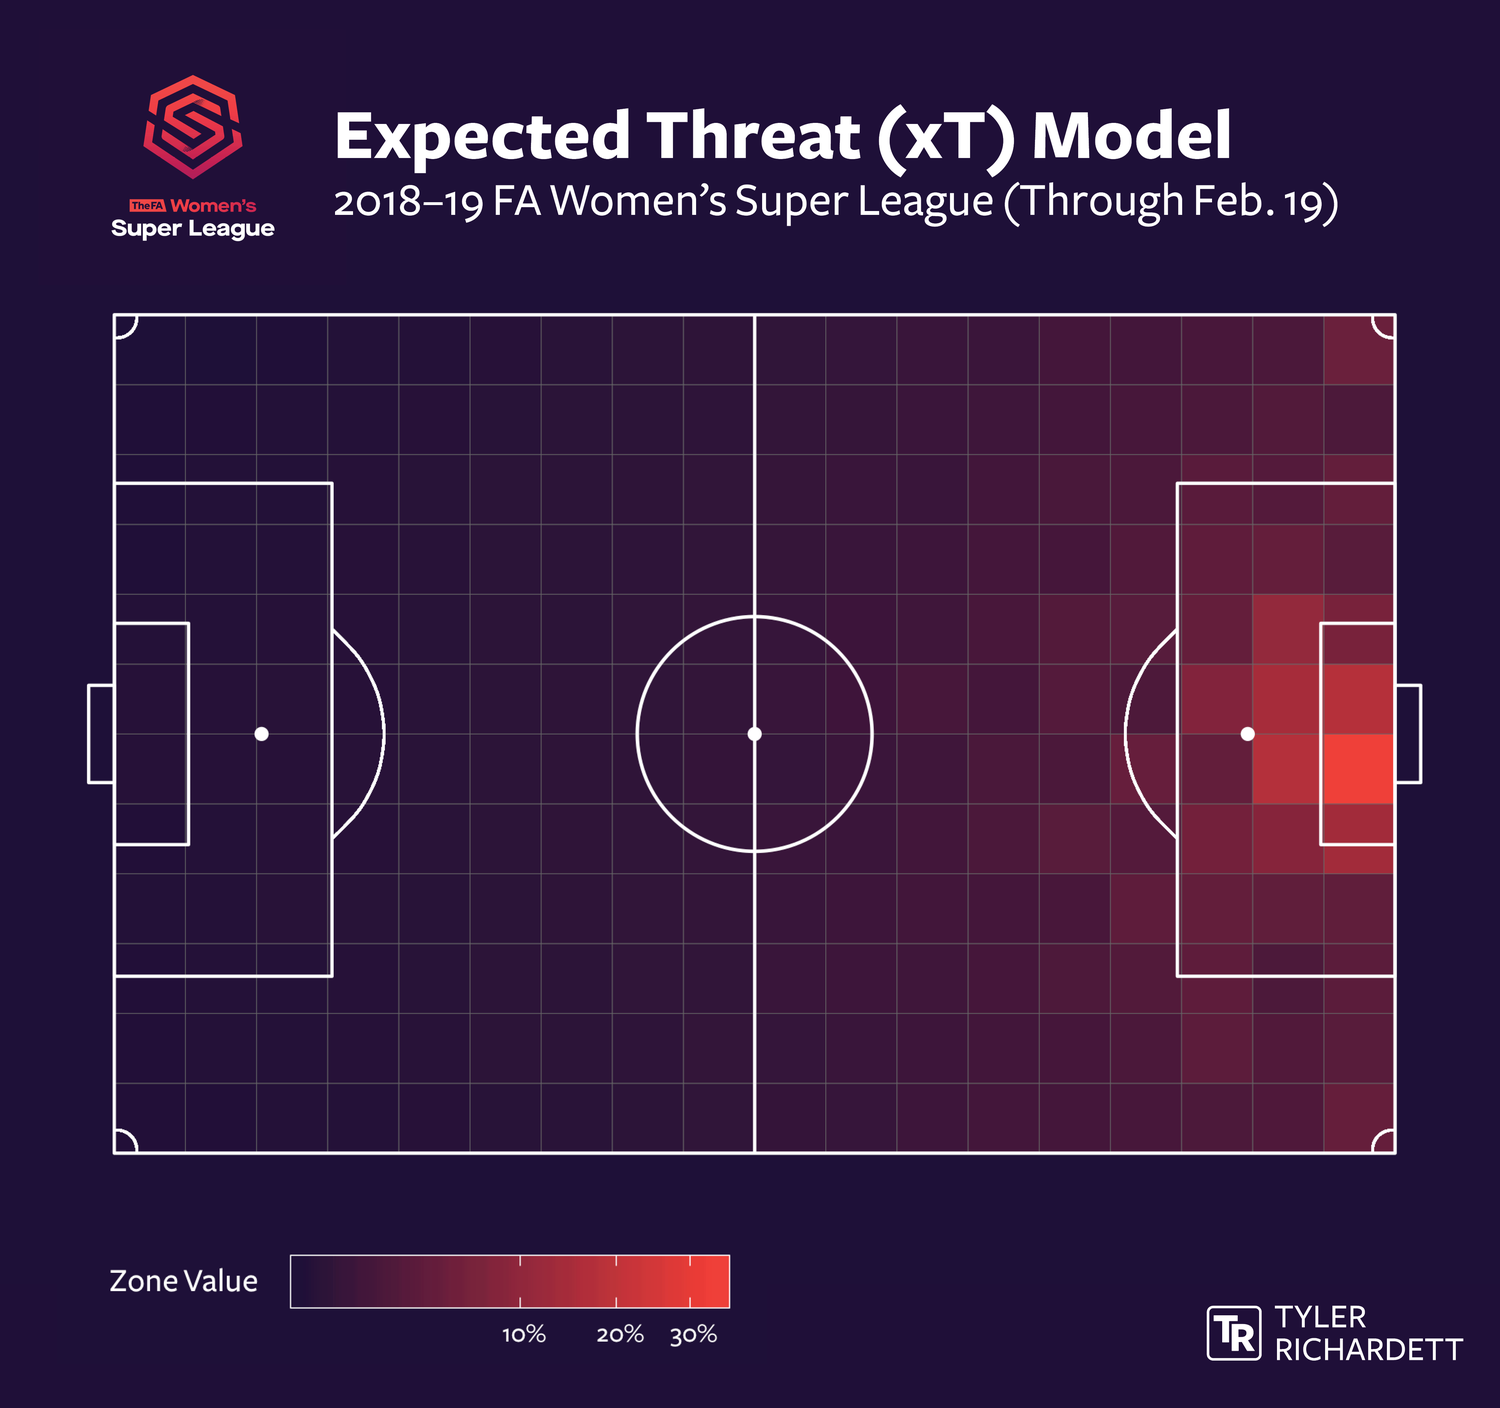
Applying the Revised xT Model to the 2018–19 FA Women’s Super League Season
Taking advantage of event-level data generously made available for free by StatsBomb, I applied my adapted xT model to the latest FA Women’s Super League season, through mid-February. The results, below, are consistent with expectations: Possessing the ball in and around the goal area yields a higher chance of scoring. Of note, the relative probability of scoring from corners is greater in the FA WSL than it was in the 2017–18 Premier League season.
Valuing Defensive Actions (xTE)
With values assigned to each of the 216 zones, I created value functions for each of the following actions with defensive implications:
- Blocked shots
- Clearances
- Fouls committed
- Interceptions
- Pressure situations
- Shots allowed
- Turnovers
Missing from this list are own goals and offside decisions. From this point forward, bemoaning a lack of tracking data will become a common theme: Without it, accurately assigning blame or credit to the relevant player(s) on own goals and offside decisions would be far too difficult.
To keep with the trend of affixing an x to the beginning each advanced metric in the sport, we’ll refer to these defensive values as xTE, or expected threat eliminated.
Blocked Shots
The expected threat (xT) of a shot could be derived from its expected goals (xG) value, which has already been modeled out and included in the StatsBomb data set. By blocking a goal-bound shot, a defender is effectively eliminating that threat altogether—unless, of course, the ball is ricocheted toward an attacker in another position on the field, or out for a corner.
As such, the xTE function for blocked shots is as follows, where \(xG_{Shot}\) is the expected goals value of the shot that is blocked, and \(xT_{z,w}\) is the expected threat value for the zone in which the ball is retrieved by an attacker, following the blocked shot. When the defense regains possession immediately following a blocked shot, \(xT_{z,w}\) is equal to zero. If the offense gains a corner kick as the direct result of a blocked shot, \(xT_{z,w}\) is equal to the probability of scoring in the sequence initiated by a corner kick.
$$xTE_{Blocked,Shot}=xG_{Shot}-xT_{z,w}$$
Clearances
The threat eliminated by way of clearances can be thought of as the reverse of the threat gained via passing or dribbling. In this context, I subtract the value of the zone to which the ball is cleared (\(xT_{z,w}\)) from the value of the zone from which the ball is cleared (\(xT_{x,y}\)).
Positive values are the result of clearing the ball from a dangerous area to a less dangerous one, whereas negative values are the result of clearing the ball into a more dangerous area. The xTE function for clearances is as follows. When the defense regains possession immediately following a clearance, \(xT_{z,w}\) is equal to zero. If the offense gains a corner kick as the direct result of a clearance, \(xT_{z,w}\) is equal to the probability of scoring in the sequence initiated by a corner kick.
$$xTE_{Clearance}=xT_{x,y}-xT_{z,w}$$
Fouls Committed
Due to a small sample size of direct free kicks, I was only able to apply the following function in order to calculate the value of conceding a penalty kick. (In an ideal world, with enough data, we could use this same approach to quantitatively define what a “good foul” looks like, outside of the penalty area.)
The xTE function for fouls committed is as follows, where \(xT_{x,y}\) is the expected threat of the zone in which the foul occurred, \(P(G|DK_{x,y},or,PK)\) is the probability of scoring in the sequence initiated by a direct free kick taken in the same zone, or of scoring directly from a penalty kick.
$$xTE_{Foul,Committed}=xT_{x,y}-P(G|DK_{x,y},or,PK)$$
Interceptions
An interception reverses possession, thus effectively eliminating all attacking threats. Therefore, the xTE function for interceptions is simply equal to the value of the zone in which the intended recipient of the pass is located (\(xT_{z,w}\)).
$$xTE_{Interception}=xT_{z,w}$$
Pressure Situations
A defensive player’s decision to pressure the ball is evaluated by looking at the corresponding pass or dribble attempt. Similarly to clearances, I subtract the value of the zone to which the ball ends up (\(xT_{z,w}\)) from the value of the zone from which the movement began (\(xT_{x,y}\)).
Positive values imply that the defensive player has forced the attacker to move the ball away from goal—either in a backward direction, or toward one of the two touchlines—while negative values imply that the defensive player’s pressure was ineffective, directly resulting in a more dangerous attacking scenario. The xTE function for pressure situations is as follows. When the defense regains possession immediately following a pressure situation, \(xT_{z,w}\) is equal to zero. If the offense gains a corner kick as the direct result of a pressure situation, \(xT_{z,w}\) is equal to the probability of scoring in the sequence initiated by a corner kick.
$$xTE_{Pressure}=xT_{x,y}-xT_{z,w}$$
Shots Allowed
The primary objective of this component was to identify instances in which a defender did not take an optimal position in reference to their marker, thus leading to a shot. To borrow again from Karun’s work, observe the following scenario:

Guilty of ball-watching, Burnley defender Kevin Long loses sight of Arsenal striker Pierre-Emerick Aubameyang, allowing Aubameyang just enough space to receive the ball and score. As a result, Long ought to shoulder the blame.
The xTE function for shots allowed is as follows, where \(xG_{Shot}\) is the expected goals value of the corresponding shot, and \(n\) is the number of defenders within a certain distance of the shooter. In my execution, I chose to share the blame among all defenders within 2 yards of the shooter.
$$xTE_{Shot,Allowed}= \frac{-xG_{Shot}}{n}$$
I also chose not to place any blame on defenders caught in breakaway scenarios (i.e., when there is no other defender, other than the goalkeeper, vertically within 10 yards of the ball). Many times, it isn’t that defender’s turnover which leads to such a dangerous opportunity; though if it is, they will be penalized by the turnovers function. This exception isn’t captured by the function; rather, these situations were simply filtered out.
Either of the two aforementioned parameters (i.e., distance to the shot and breakaway distance) could be adapted as needed. Regardless, this isn’t a perfect solution for identifying marking responsibilities, and it’s another situation in which the application of tracking data (to capture defensive responsibilities) would be particularly welcome.
Turnovers
Finally, turnovers were important to account for from a defensive standpoint, as they gift an attacking threat to the opposing team. Each of the three possible types—incomplete passes, being dispossessed, and miscontrols—can be applied to the following xTE function, where \(xT_{z,w}\) is the value of the zone in which the pass or dribble immediately following the turnover ends. As with shots allowed, all values are negative.
$$xTE_{Turnover}= -xT_{z,w}$$
Rating Defensive Players in the 2018–19 FA WSL Season
The table below shows the top 20 players with the highest cumulative xTE values. Ten of the 11 teams in the league have at least one representative, with Bristol City, Liverpool, and Yeovil Town having three. Based on a quick glance at the league table, the first two check out. Bristol City and Liverpool offenses are relatively ineffective, and it has been their defensive performances that have kept them out of the relegation spot. Last-place Yeovil Town is a different story—they have conceded 42 goals over 14 matches—and the inclusion of these players is likely due to the opposing offenses' constant bombardment more than anything else.
Finally, seeing the name of England and league-leading Manchester City captain, Steph Houghton, tells me I’ve done something correct here.
| Rank | Player | Team | xTE |
|---|---|---|---|
| 1 | Frankie Brown | Bristol City WFC | 5.062 |
| 2 | Sophie Elizabeth Bradley-Auckland | Liverpool WFC | 5.01 |
| 3 | Gemma Evans | Bristol City WFC | 4.46 |
| 4 | Stephanie Houghton | Manchester City WFC | 4.019 |
| 5 | Hannah Short | Yeovil Town LFC | 3.986 |
| 6 | Gilly Louise Scarlett Flaherty | West Ham United LFC | 3.341 |
| 7 | Kirstyn Pearce | Reading WFC | 3.263 |
| 8 | Ellie Mason | Yeovil Town LFC | 2.749 |
| 9 | Victoria Williams | Brighton & Hove Albion WFC | 2.692 |
| 10 | Danique Kerkdijk | Bristol City WFC | 2.618 |
| 11 | Georgia Brougham | Everton LFC | 2.617 |
| 12 | Brooke Hendrix | West Ham United LFC | 2.593 |
| 13 | Gabrielle George | Everton LFC | 2.474 |
| 14 | Meaghan Sargeant | Birmingham City WFC | 2.421 |
| 15 | Nicola Cousins | Yeovil Town LFC | 2.256 |
| 16 | Millie Bright | Chelsea LFC | 2.195 |
| 17 | Rhiannon Roberts | Liverpool WFC | 2.128 |
| 18 | Kerys Harrop | Birmingham City WFC | 1.783 |
| 19 | Magdalena Ericsson | Chelsea LFC | 1.58 |
| 20 | Niamh Fahey | Liverpool WFC | 1.565 |
Accounting for Opponents' Offensive Strength
In an attempt to take these rankings one step further, I weighted the xTE value of each defensive action by the opposing team’s offensive potency. So, when a defender squares up against a consistently dangerous attack, her positive defensive actions (such as clearances) will earn a greater positive value, but her negative unfavorable defensive actions (such as turnovers) will earn a greater negative value.
First, I attempted to create an xT matrix for each team in the league, but I was unsuccessful, as the sample sizes were too small—particularly for the weakest teams:
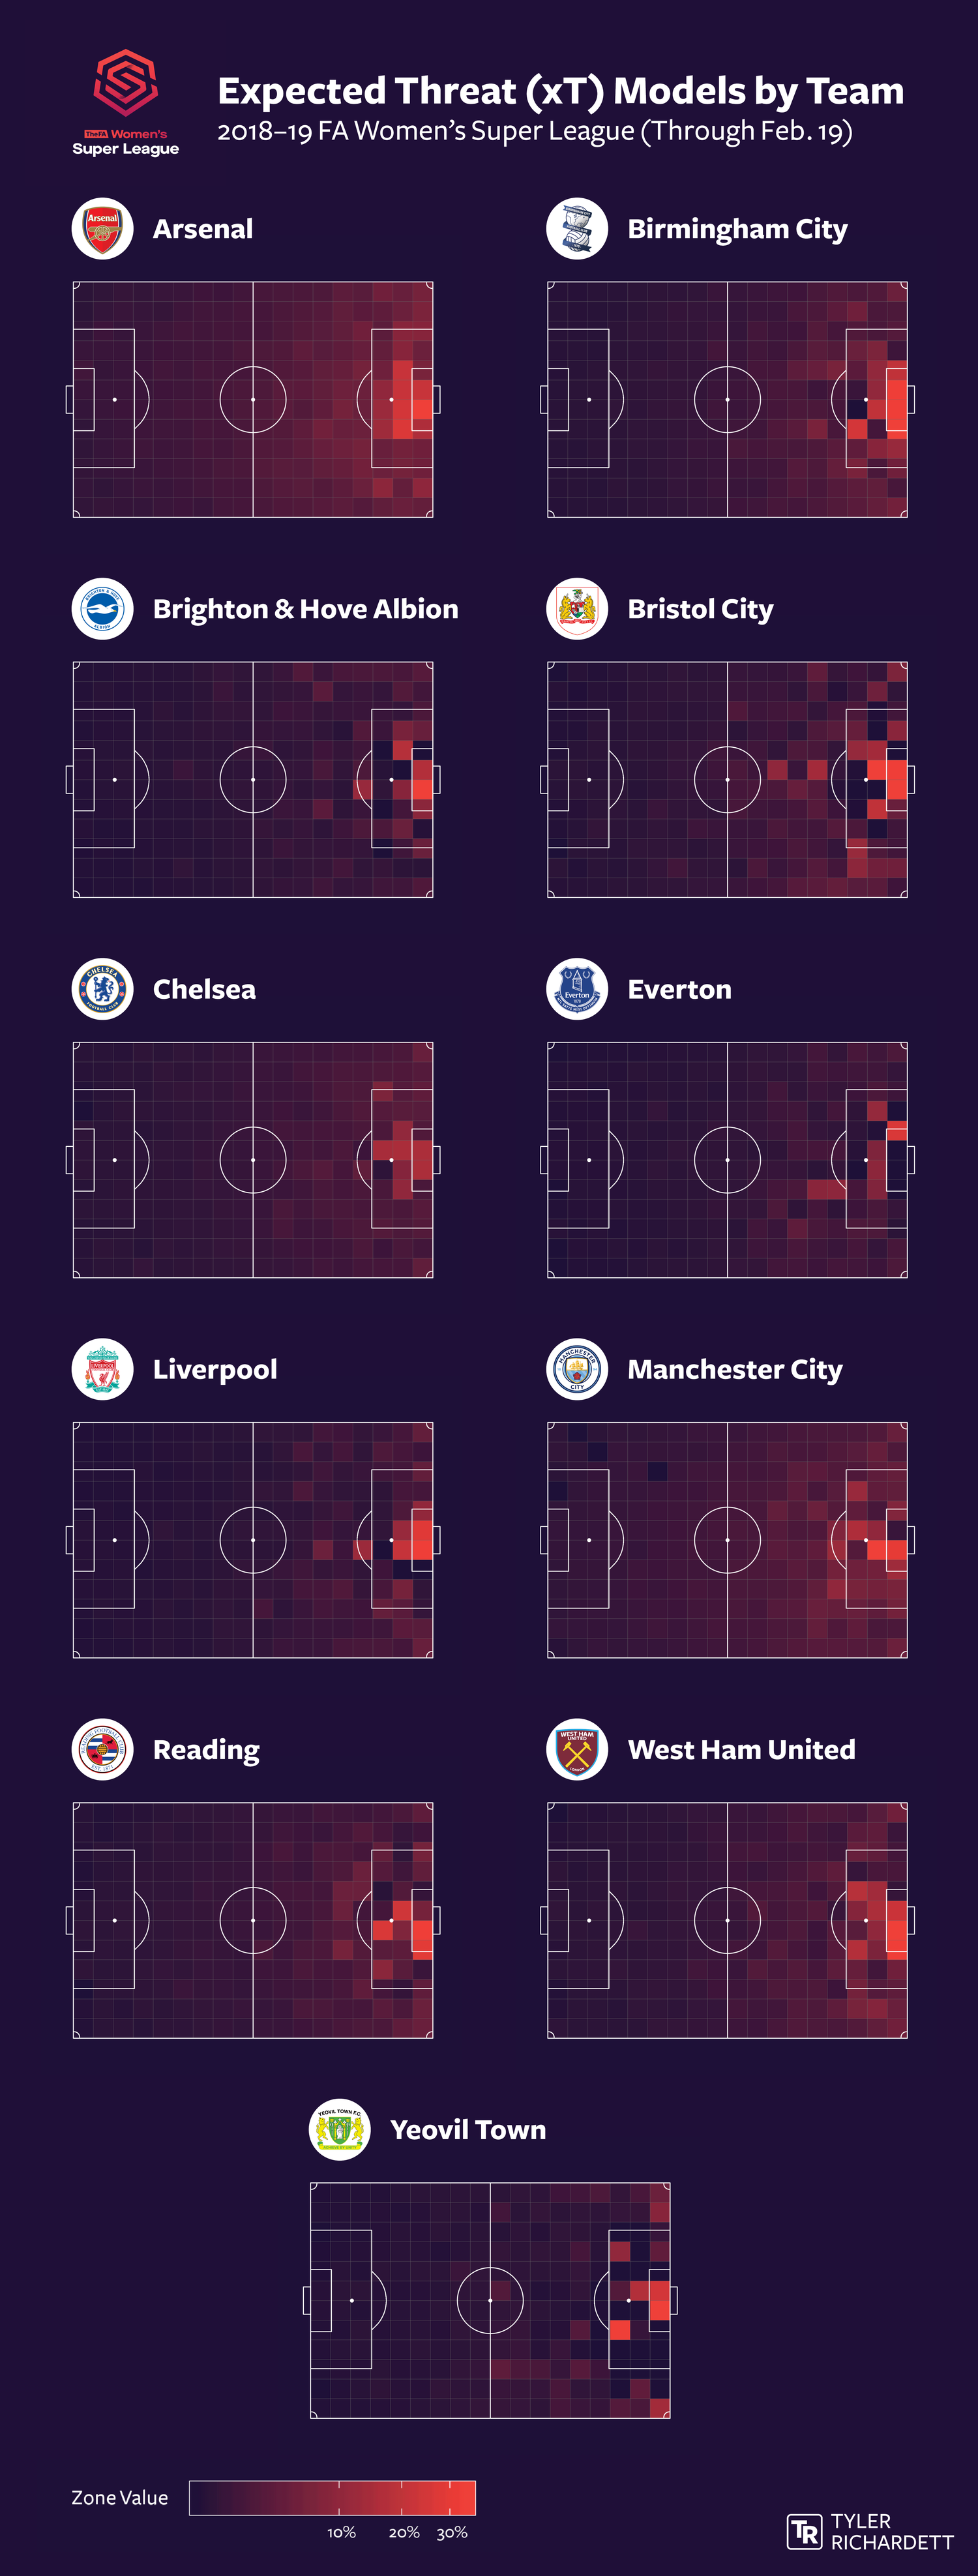
To weight the opposing team’s attack, I instead used the offensive coefficients generated for each team by the Dixon-Coles model, the inputs for which are the current season’s results. (The dixoncoles function in Ben Torvaney’s regista package proved helpful in doing so.)
The revised table of top 20 players, based on weighted xTE values, is below. It includes the same 20 players, though their order has shuffled. Upward movement could be an indicator of which defenders “show up [or make fewer mistakes] in the big games.”
| Rank | Player | Team | Weighted xTE | |
|---|---|---|---|---|
| 1 | – | Frankie Brown | Bristol City WFC | 7.959 |
| 2 | ▲ 1 | Gemma Evans | Bristol City WFC | 5.991 |
| 3 | ▼ 1 | Sophie Elizabeth Bradley-Auckland | Liverpool WFC | 5.692 |
| 4 | – | Stephanie Houghton | Manchester City WFC | 4.936 |
| 5 | ▲ 5 | Danique Kerkdijk | Bristol City WFC | 4.118 |
| 6 | ▲ 8 | Meaghan Sargeant | Birmingham City WFC | 3.928 |
| 7 | ▲ 2 | Victoria Williams | Brighton & Hove Albion WFC | 3.856 |
| 8 | ▲ 5 | Gabrielle George | Everton LFC | 3.84 |
| 9 | ▼ 3 | Gilly Louise Scarlett Flaherty | West Ham United LFC | 3.819 |
| 10 | ▼ 3 | Kirstyn Pearce | Reading WFC | 3.808 |
| 11 | ▼ 6 | Hannah Short | Yeovil Town LFC | 3.699 |
| 12 | – | Brooke Hendrix | West Ham United LFC | 3.624 |
| 13 | ▼ 2 | Georgia Brougham | Everton LFC | 3.532 |
| 14 | ▼ 6 | Ellie Mason | Yeovil Town LFC | 3.474 |
| 15 | ▲ 4 | Magdalena Ericsson | Chelsea LFC | 2.96 |
| 16 | ▲ 1 | Rhiannon Roberts | Liverpool WFC | 2.791 |
| 17 | ▲ 1 | Kerys Harrop | Birmingham City WFC | 2.458 |
| 18 | ▼ 3 | Nicola Cousins | Yeovil Town LFC | 2.455 |
| 19 | ▼ 3 | Millie Bright | Chelsea LFC | 2.303 |
| 20 | – | Niamh Fahey | Liverpool WFC | 2.288 |
Closing Thoughts
In no particular order, here are some parting thoughts on the topic:
Defensive statistics are difficult, and it’s no wonder that this aspect of the game continues to be under-analyzed. The type and volume of a defender’s work varies game-to-game, and it’s entirely dependent on the opponent’s actions. A defender can’t make work for herself; she can only respond to an onrushing attack. And it could be argued that the most valuable work is done entirely off the ball—by occupying key spaces on the field and forcing the opponent to attack via a less-optimal channel.
For these reasons, and in the interest of time, I did not regularize the xTE metrics in the table above. Arsenal’s defensive players must be good to play for Arsenal (the only team of the 11 that is missing), of course, but this transformation will likely not ensure their appearance on these lists, either. They may rarely be put in positions to show off their talents in any of the manners listed above—because their offense retains a high share of possession each match, or their defense plays a high line and those defensive actions take place in less valuable areas of the pitch, or a mixture of both.
Incorporating tracking data into models such as these will be monumental, and some of that work is already underway—primarily on the offensive side of the ball. Again, a defender’s most valuable contributions may be instances in which her mere existence convinces offenses to try another route toward goal. That nuance is lost with only event-level data.
xTE, as well as xT, are one-dimensional metrics. But, combining these values, as well as some metric to represent duel outcomes, may be a nifty way of calculating players' overall contributions. (Think plus-minus stats in the NBA, minus the regression.)
Data: StatsBomb